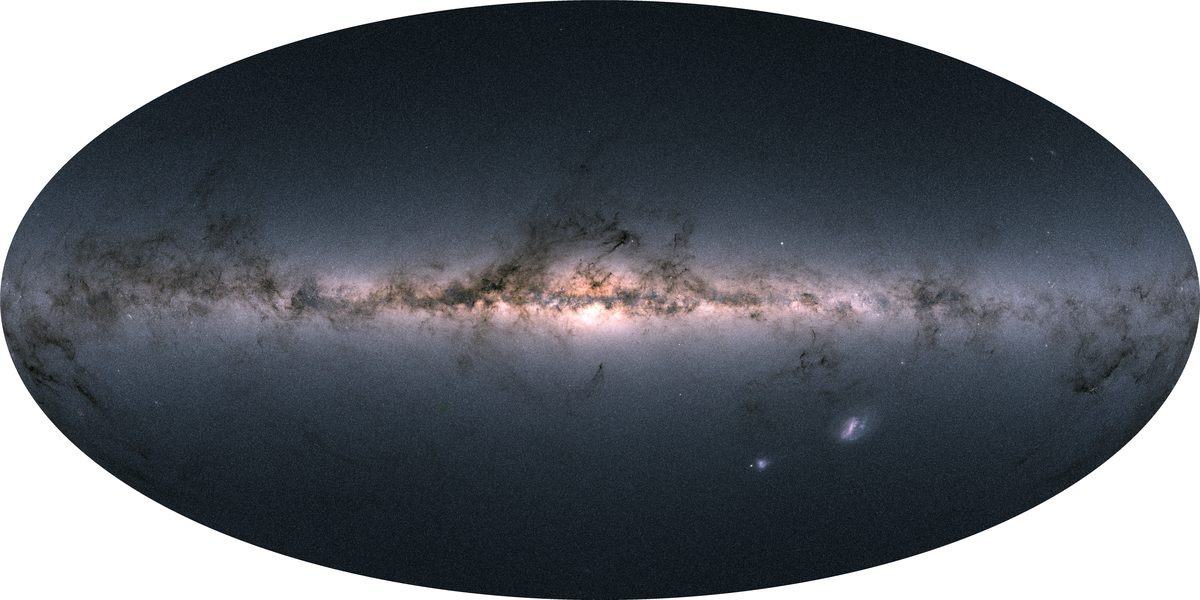
One star or two?
A white dwarf next to a normal star adds some extra blue light to the spectrum, so you can find these pairs in Gaia data. But Gaia's spectra aren't perfect in the blue either. Even after Huang et al.'s correction, they only agree with reference spectra to within about 2% there.
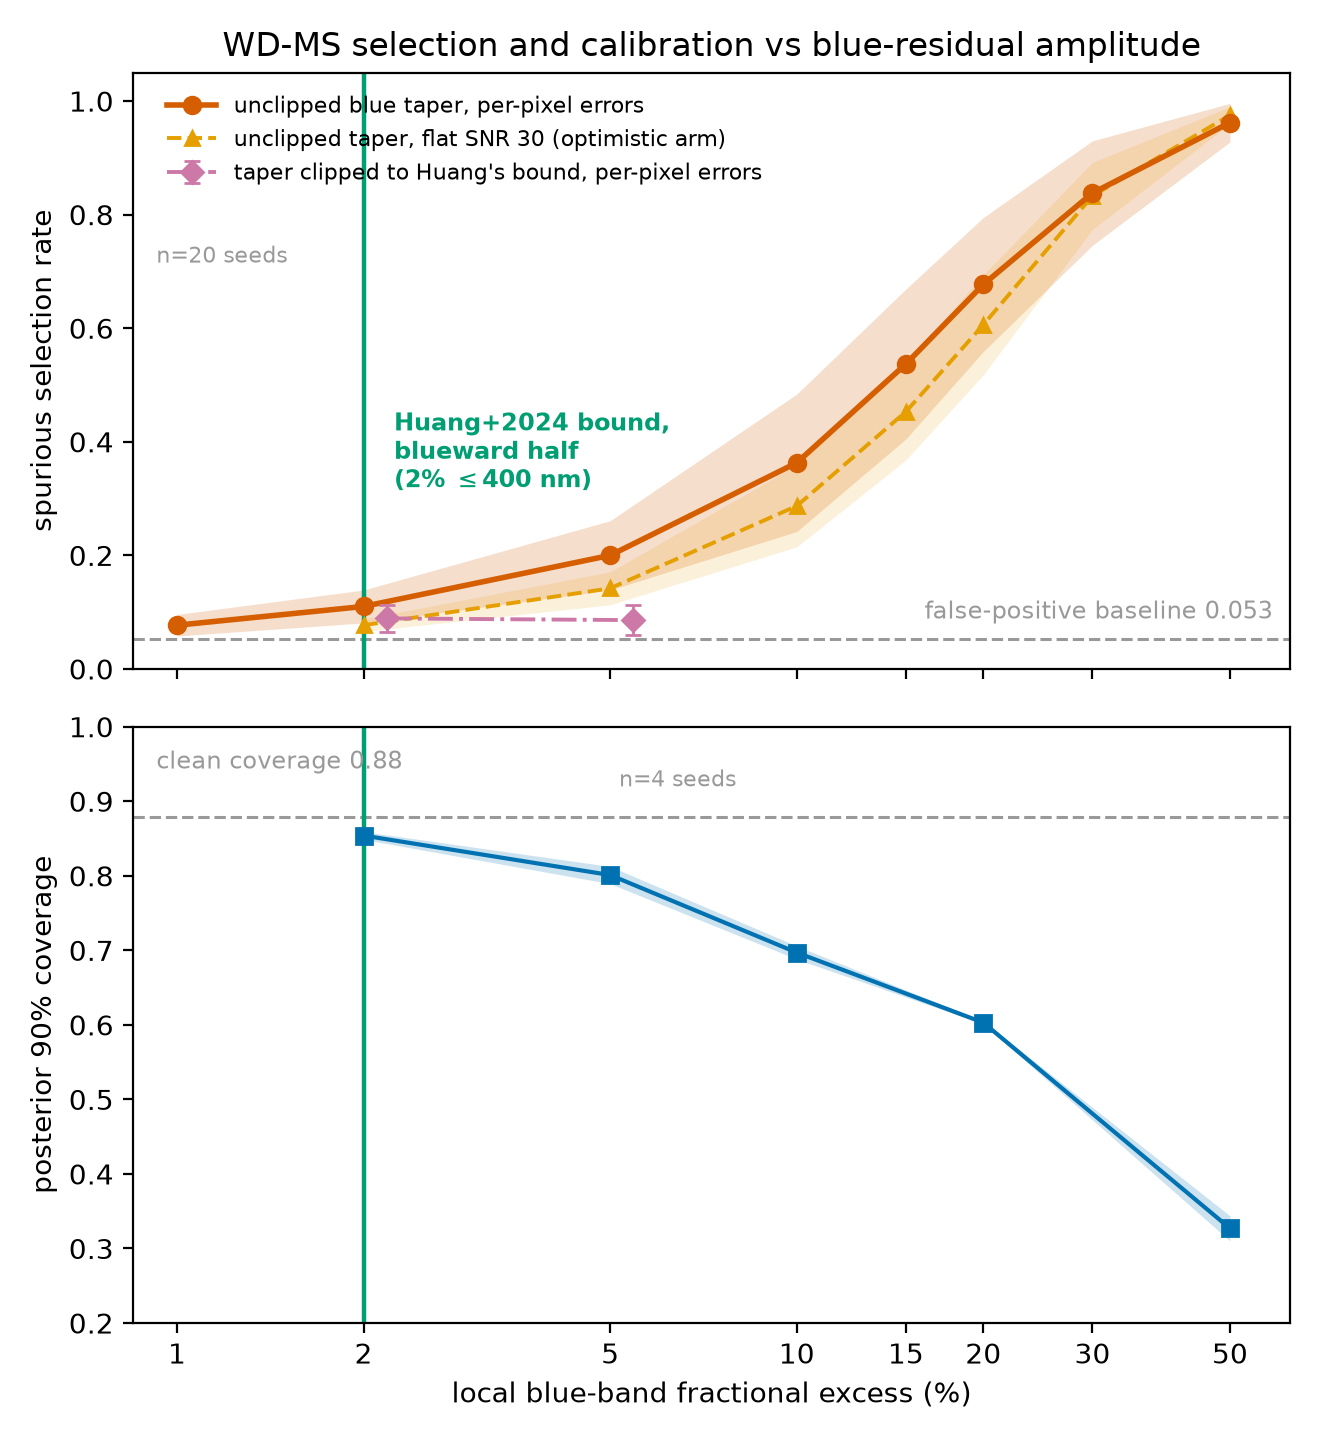
So the question was whether that 2% could make a single star look like it has a white dwarf next to it. At 2% it nudges it a bit, from about 5% of single stars getting picked as binaries to about 9%. At a 5% error it's 20%, and by 15% more than half of them get picked.
The longer story
The 2% comes from Huang et al., who corrected Gaia's spectra. It's a local number: after their correction the blue part can be off by up to about 2% and the redder part by about 1%. That's 2% of the light at those wavelengths, and it's easy to accidentally read it as 2% of all the star's light.
That difference matters most for cooler stars, because they give off little blue light. Put 2% of their total light into the blue and you get a median local error of 55%, 27 times bigger than the bound Huang et al. actually measured.
I couldn't rerun the classifier that built the catalog, so I used a stand-in. I took real Gaia spectra of single stars, added the blue error, and checked whether a binary fit beat a single-star fit.
There's a catch in that. If the comparison spectra have the same calibration error as the star, most of it cancels. Nobody has measured how much of the error the real catalog stars share, so my numbers are a stress test of the method and shouldn't be read as the catalog's contamination rate.
As an outside check I used GALEX ultraviolet data, since hot white dwarfs are bright in the ultraviolet. Higher-scoring candidates were detected more often. The groups had different sky coverage though, so that pattern on its own doesn't prove which ones are real.
For astronomers: setup, rates, caveats
- Catalog
- Li et al. (2025) Gaia XP WD+MS candidates: 30,131 rows, all prob_binary > 0.8 (post-cut FaintQC)
- Residual bound
- Huang et al. (2024): corrected XP consistent to better than 2% at 336–400 nm and 1% at redder wavelengths. Local, per wavelength.
- Units check
- 2% of total flux placed in the blue is a median 55% local excess across the MS templates, 27× the local bound
- Templates
- 120 single MS stars and 120 single WDs; fits on a 50 + 50 subsample, leave-one-out. A Δχ² threshold stands in for the classifier, which is not rerun.
- At the bound
- Clipped blue taper: spurious rate 0.09 ± 0.02 over 20 seeds vs a 0.053 baseline (19 of 20 above), ≈1.7× baseline. Unclipped 2% taper: 0.11 ± 0.03.
- Above the bound
- Spurious rate 0.20, 0.36, 0.54, 0.68, 0.84 at 5, 10, 15, 20, 30% local excess, 0.96 near 50%. Bulk failure only above 10–15%.
- Noise model
- Per-pixel errors vs flat SNR 30: mean difference +0.032 ± 0.007, positive in 15 of 20 seeds
- Coverage
- Clean 90% coverage 0.873–0.889 (discrete-rank null 0.882). With the unclipped 2% taper 0.85, then 0.80, 0.70, 0.60, 0.33 at 5, 10, 20, ≈50%. Companion-fraction coverage 0.79 at 2%, 0.47 at 5%.
- BIC gate
- AUC ≈ 0.93 at 20% local excess for bright WD shares; near chance (AUC 0.43) at the catalog's median WD flux share of ≈0.01
- GALEX FUV
- Detection fraction 0.28 → 0.59 from lowest to highest prob_binary tercile (GALEX coverage 8.1%, 11.6%, 16.9%). Off-sequence WD fits 19% vs on-sequence 50%. 127 spectroscopically confirmed WD+MS: 91%.
The released classifier is never run. The residual is unmeasured outside Huang et al.'s colour–magnitude box, which excludes about 40% of the catalog, and the caution at the bound depends on whether the residual reaches 10–15% there. Coverage numbers describe amortized methods, not the released catalog. Single-star truth sources are selected by RUWE, non_single_star and CMD position without spectroscopy, so the measured elevation is a lower bound.
Paper and code
Akbari, K. “A Calibration Audit of a Gaia XP White-Dwarf Main-Sequence Binary Catalog: How Much the BP-Band Residual Contaminates at Its Bound and Above.” Preprint, arXiv:2607.08856.
Read the preprint · Code and audit records
Inputs: Huang et al. (2024), the XP flux correction · Li et al. (2025), the candidate catalog