Would the search even catch it?
People look for pairs of supermassive black holes by searching quasar light curves for a period. To turn "we found N" into "there are this many out there", you need to know how often the search catches a real one. Lin, Charisi and Haiman measured that in 2026 for the Lomb-Scargle periodogram, on PTF quasars, which are bright and heavy, mostly around a billion solar masses.
Sayantan Bhattacharya and I wanted to see how those numbers change for lighter black holes. So we took black hole mergers from the TNG100 simulation, from a million to ten billion solar masses, gave each one a quasar light curve, hid a periodic signal in it, and ran the same kind of search.
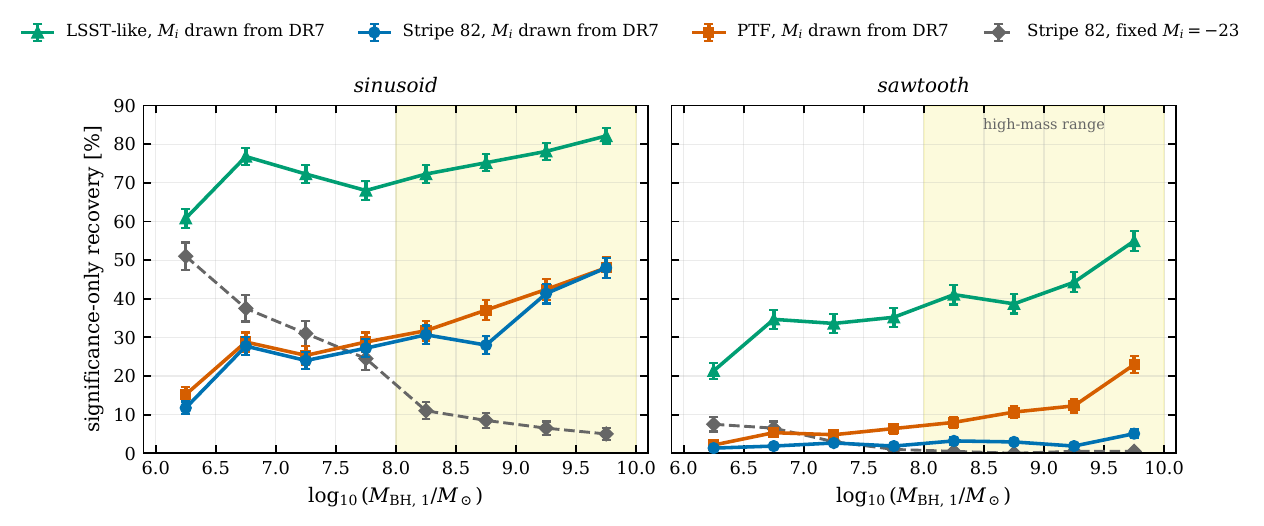
Whether heavy binaries are easier or harder to catch turns out to depend on how bright you assume each quasar is. Give them all the same brightness and the heavy ones get harder. Give them the brightness real quasars of that mass have and the heavy ones get easier, from 15% caught in the lightest bin to 48% in the heaviest on PTF.
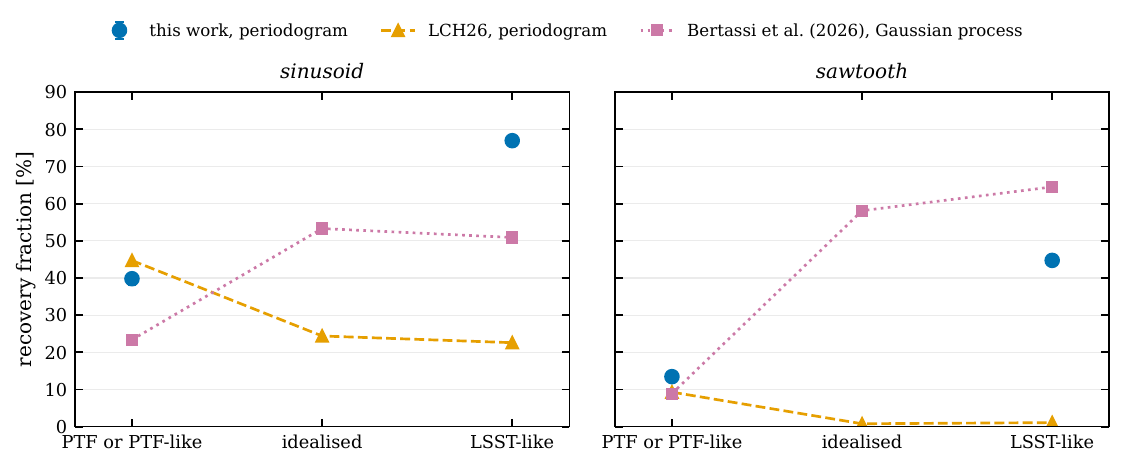
For the heavy ones on PTF our version catches 39.8% of the signals, close to the published 44.7%. On a cadence like the coming LSST survey it catches 76.9%, where the published value is 22.6%. The two setups differ in several inputs, and the paper goes through them one by one, but most of that difference is still unexplained.
The longer story
A quasar flickers randomly, and random flickering is good at faking a period. So the search only counts a peak in the periodogram if it beats the tallest peak from 100,000 light curves of pure flicker made for that same quasar. This follows the rule Lin, Charisi and Haiman set up.
How much a quasar flickers depends on its black hole mass and its brightness. The simulation gives you the mass but not a sensible brightness, because most of its black holes are not shining as quasars when they merge. So each binary got the brightness of a real SDSS quasar with a similar mass, picked from about 105,000 of them.
That choice is what flips the mass trend. At a fixed brightness, heavier black holes flicker more and hide the signal. In real quasars heavier also means brighter, and brighter quasars flicker less, which more than cancels it.
We used three kinds of cadence: the real observation times of 49 PTF quasars, one real Stripe 82 light curve with 60 nights over nine years, and an LSST-like one with 484 nights over almost ten years. Even the sparse Stripe 82 cadence catches 37% of the sinusoids from heavy binaries.
Signals shaped like a sawtooth, a sudden drop and a slow climb back, are much harder. On PTF we catch 13.5% of them, on Stripe 82 only 3.3%, and even on the LSST-like cadence we miss more than half.
We also tried sampling the same PTF baselines every day. In our runs the extra points did not lower recovery beyond the error bars in any test.
The paper lists the recovery in each half-dex mass bin, for both signal shapes on all three cadences, so a forecast can use a different detection rate at each mass.
For astronomers: data, method, caveats
- Binaries
- TNG100-1 public merger catalogue, 18,374 mergers. Primary mass from the black hole details record, log M1 6.07–10.09. Eight 0.5-dex bins over [6, 10), 375 systems per bin, 3000 per run.
- Magnitudes
- Mi(z = 2) drawn per system from the 200 nearest-mass Shen et al. (2011) DR7 quasars (104,740 with a virial mass). Below log M = 6.502 a linear extrapolation with 1.02 mag scatter (16.2% of systems).
- Noise
- DRW with τ and σ from the MacLeod et al. (2010) relations. Photometric errors 0.05 (PTF), 0.02 (Stripe 82), 0.01 mag (LSST-like).
- Signals
- Sinusoid and sawtooth, A ~ U[0, 0.5) mag, P ~ U[30, 779] d (U[200, 1100] d on Stripe 82).
- Cadences
- 49 observed PTF cadences of the Charisi et al. (2016) quasars (6207 epochs); one Stripe 82 light curve, 60 epochs over 9.14 yr; LSST-like, 5 d sampling with 1 d jitter and a 4-month annual gap, 484 epochs over 9.66 yr.
- Detection
- Generalised Lomb-Scargle, 1000 log-spaced frequencies from 1.5/T to 1/30 d−1 in 25 bins. Significant if the injected periodogram beats the maximum over NMC = 105 null light curves in any bin, which caps the false-positive probability per light curve at 2.5 × 10⁻⁴.
- High mass, PTF
- Sinusoid 39.8 ± 1.6% (published: 44.7), sawtooth 13.5 ± 0.9% (published: 9.3). Errors widened for the shared cadences.
- High mass, LSST-like
- Sinusoid 76.9 ± 1.1% (published: 22.6), sawtooth 44.7 ± 1.3% (published: 1.1). With Mi = −23 fixed: 49.5% and 22.4%.
- High mass, Stripe 82
- Sinusoid 37.0 ± 1.2%, sawtooth 3.3 ± 0.5%.
Of the 4.9-point PTF sinusoid difference, 1.4 points come from our fixed period range, which puts some injected periods past the search range of the shorter cadences. The rest, and most of the LSST-like difference, have no single identified cause, and the paper lists the candidates. Because DR7 is flux limited, the magnitudes drawn at low mass are brighter than typical, so the low-mass recovery is likely too high for a deeper survey. Host-galaxy light is not modelled. The null light curves use each system's true DRW parameters, where a real search has to estimate them. The threshold keeps rising with NMC: going from 104 to 105 lowered recovery by 7 to 10 points. A TNG100-1 merger is a kiloparsec-scale event, and the injected periods correspond to gravitational-wave frequencies of at least 21 nHz, at and above the upper end of the pulsar timing array band.
Paper and code
Akbari, K. & Bhattacharya, S. “Lomb-Scargle Recovery of Periodic Binary Signals across Black Hole Mass and Cadence.” Preprint, arXiv:2610.30772.
Read the paper (arXiv) · TNG population pipeline. The injection-recovery outputs and analysis code are available on request.